
Arts Education Impact Reports: 3 Templates for End of Cycle Reporting


The calendar year-end, your organization’s fiscal year-end, or the end of a season—each of these transitions is an ideal time for arts and community education program admins to:
- Evaluate education program performance. Being able to answer “what’s working” and “what needs attention” with confidence and transparency is part of fostering continued support for the program.
- Tell the story of the education program and its impact to key stakeholders. Board members, community members, current and prospective funders, a lot of folks can influence how your program is viewed and resourced. Showing them impact proactively helps to safeguard the work you’re doing.
This post—written in collaboration with arts marketing expert, Kate Brandt—explores the most common questions arts education admins need to answer in these transition moments to make sure their programs are resourced and set up for success. For each high-level question, we’ll walk through exactly how to get the data you need, package it for your target audience, and how to take action based on the results.
Photos and testimonials can be a good way to convey the impact of education programs, but they don’t tell the whole story, and they don’t speak to everyone. When you’re looking to balance the qualitative with the quantitative, look to data to tell the rest of the story.
 Kate Brandt
Arts & Culture Consultant at Kate Brandt Marketing
Note: This post is part I with a part II to be released with 3 additional key questions and reports!
Skip to what matters most to you:
- [GROWTH] Where did program participation grow, where did it shrink?
- [RETENTION] Who came back and who didn’t?
- [REACH] Who did we reach in terms of age, location, demographics, etc.?
1) Where did program participation grow, where did it shrink?
Understanding where the program is growing and where it may be shrinking should inform how you adjust in your next cycle. Being able to speak confidently and clearly about these realities also builds your credibility as a program owner.
In this example, we look at growth across disciplines and age groups but repeat this process for the segments that matter to your organization.
To answer this question, look at: Enrollment data from this period (calendar year, fiscal year, season, etc.) compared to the previous period.
Export the following as one row per student enrollment in a class or camp:
- Unique student ID
- Class ID
- Class name
- Program category or discipline (e.g. “Ceramics”)
- Age group
- Enrollment status (e.g. Confirmed, Canceled, Waitlisted) ← Exclude cancelled or waitlisted enrollments from this report
Then, calculate enrollment growth by category/discipline. Look at numerical change and growth percentage. Numerical change will show you which disciplines contributed most to overall growth or decline.
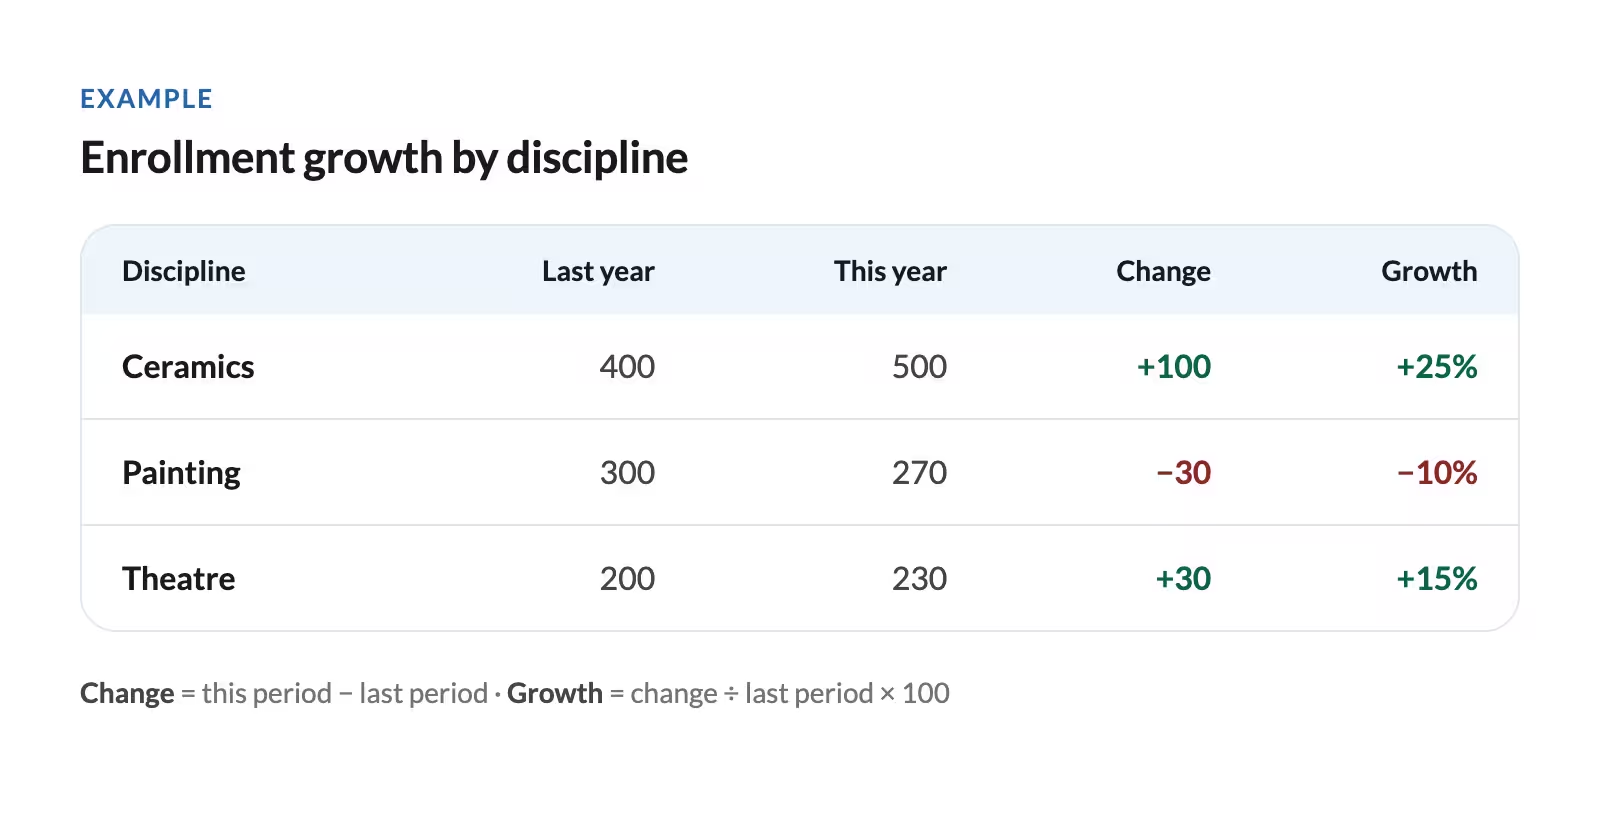
Repeat the process for Age Group or any other aspect you’re interested in.
To determine if you reached more people: Count distinct student IDs in each period, then calculate the change and growth percentage again.
If you’ve increased or decreased offerings, you’ll want to distinguish growth from offering more opportunities versus filling more of the classes you offer. Pull these figures for each period, overall and by discipline, age group, and any other slice you’re looking at.
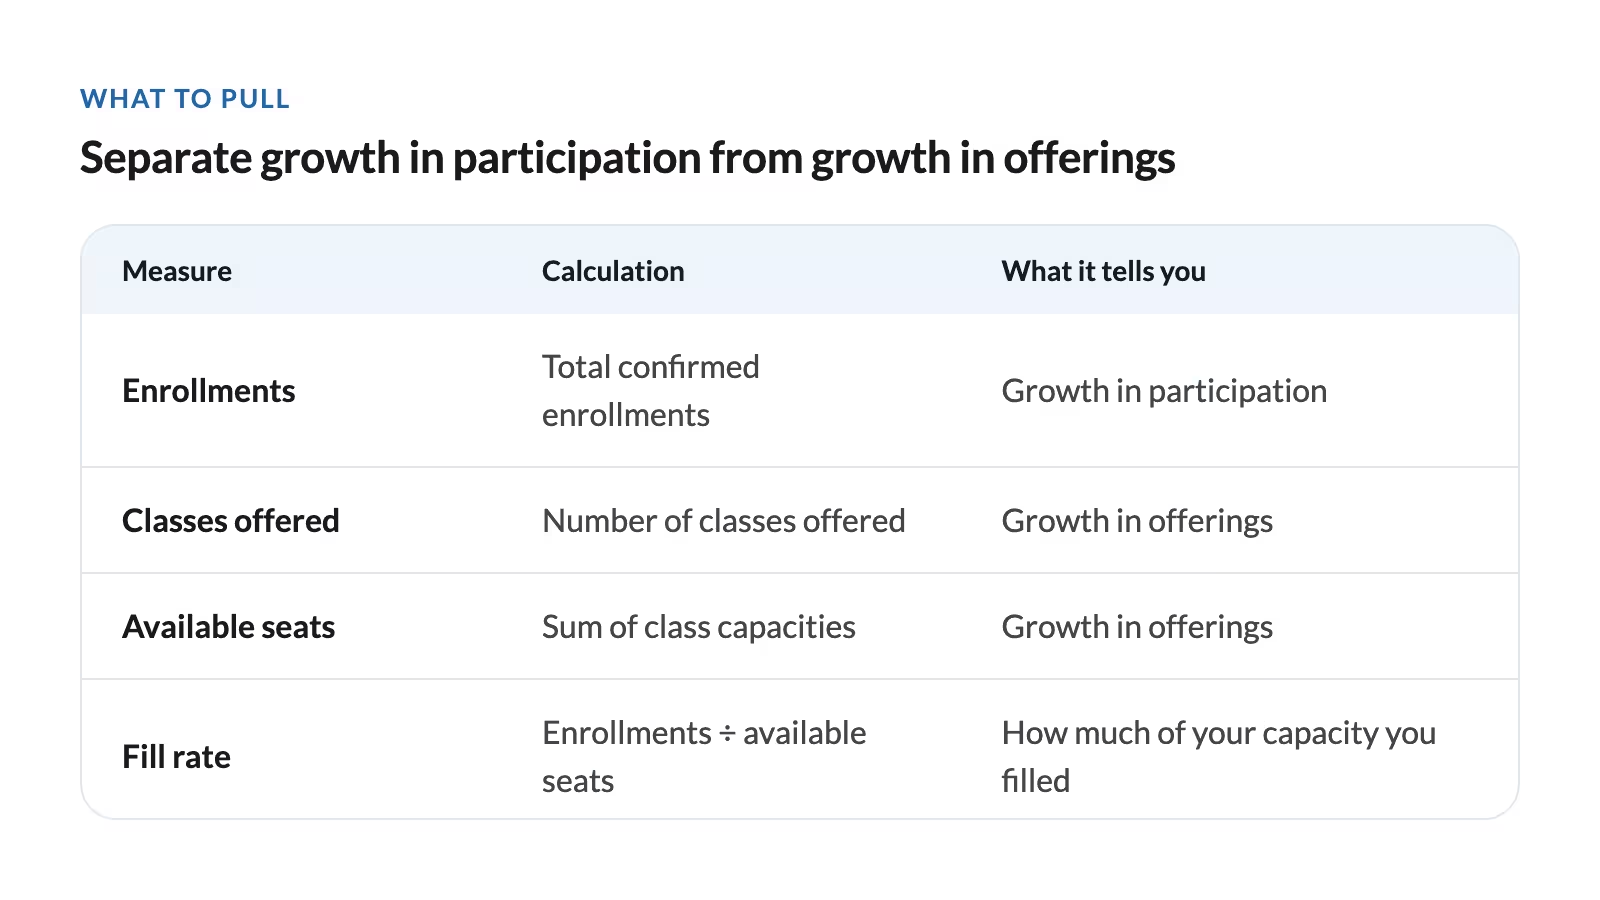
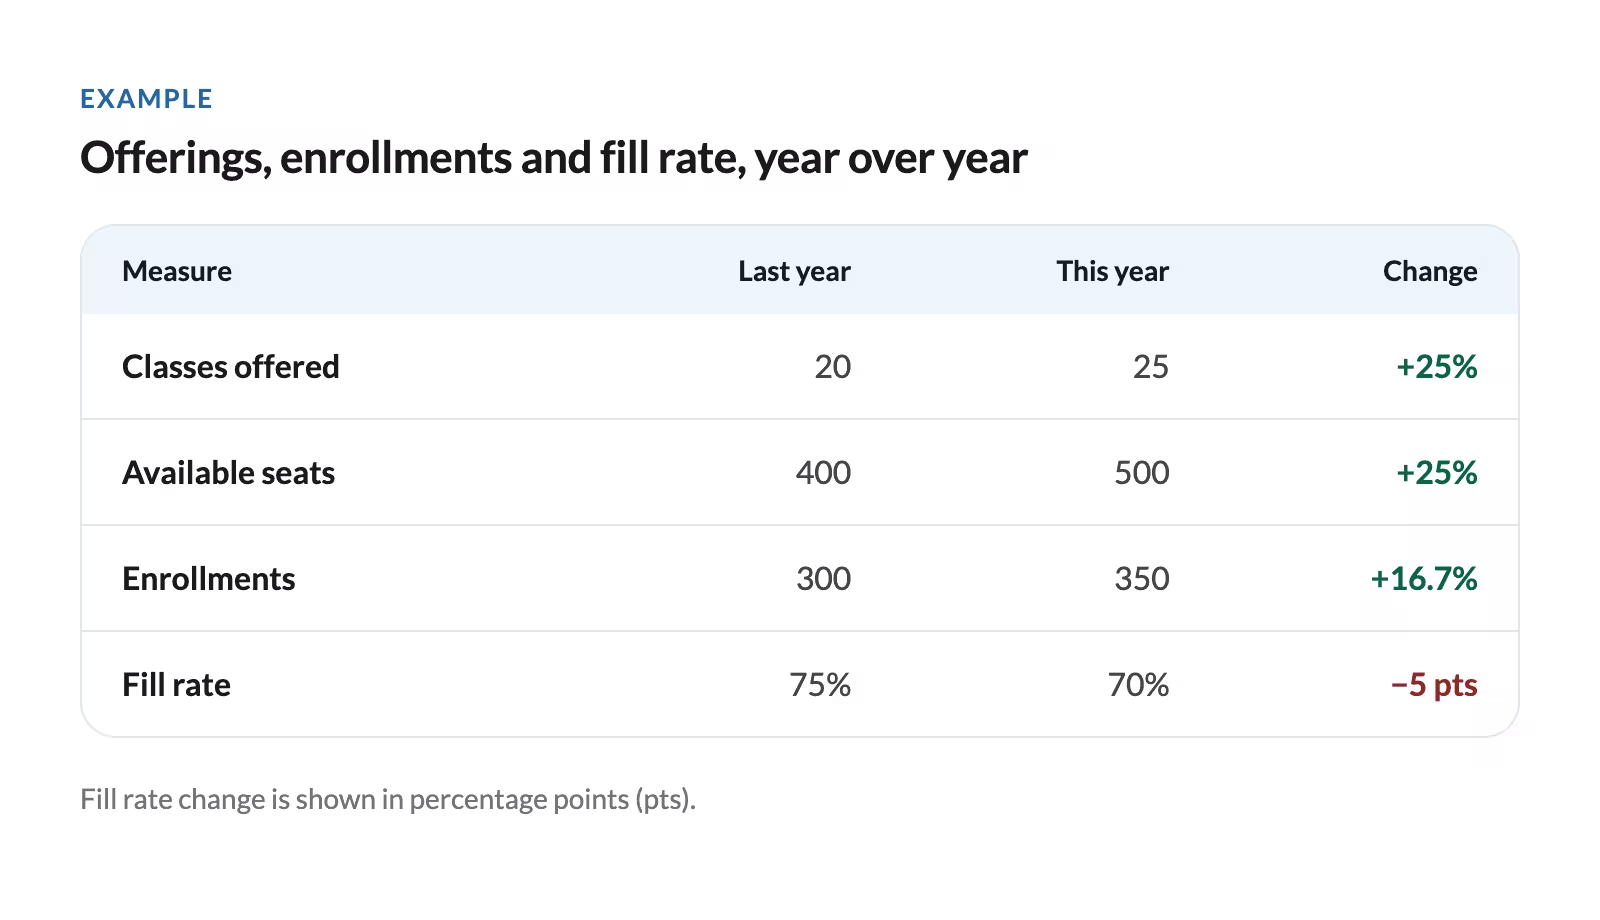
Read the results this way:
- Enrollments and fill rate both rise: You’re serving more enrollments and filling capacity more successfully. ← Amazing work! Can you increase capacity again?
- Enrollments rise, fill rate stays flat: Growth is proportional to added capacity. ← Likely a good choice to increase capacity, things are stable
- Enrollments rise, fill rate falls: Capacity expanded faster than participation. ← Keep eyes on this; you may have increased offerings too aggressively
- Enrollments fall, fill rate rises: Reduced capacity may explain the decline; remaining offerings are filling more successfully. ← Likely a good choice to reduce capacity, keep watching!
- Enrollments fall, fill rate stays flat: Participation declined in proportion to available seats. ← No alarm bells yet, things are steady
- Enrollments fall, fill rate falls: You’re seeing fewer enrollments and filling a smaller share of available seats. ← Take a good look at these classes and evaluate if they still make sense for your program
How to use this data
- Decide what needs further investigation. If you’ve seen a decline in enrollments in your Painting classes, do you understand why? Look at additional data sources like student and instructor feedback to help you diagnose what happened.
- Decide what to adjust, if anything, in your next cycle. If enrollments and fill rate increased, consider adding another section. If you didn’t reduce capacity but enrollments fell, get more data (see the previous bullet point) and make a plan for how to adjust—additional promotion, an instructor change, a format or timing change, etc.
- Make a specific request to leadership. For example: Ceramics was responsible for the majority of enrollment growth last season. We’d like to bring on another instructor to expand our capacity further and expect to see these classes at 80% fill rate or above.
- Bring the findings to staff and instructors. Get their opinions and gather qualitative data. Ask what helped successful offerings work, what made weaker offerings difficult, and what support might be needed.
Answering this question with CourseStorm
CourseStorm’s Just Ask Reporting makes answering questions like this simple. Rather than exporting data and running calculations in spreadsheets, you can just ask it to quickly build the tables you need.
An example prompt:
Compare total enrollment records from January 1–November 6, 2025, with January 1–November 6, 2026. Count every qualifying class enrollment, even when the same student enrolled in multiple classes. Exclude canceled registrations and all waitlist entries. Show each period’s total, the numerical change, and percentage change. Then provide separate breakdowns by class category and by these age groups: [insert ranges].
You can continue to prompt our reporting assistant in plain language until you get the data you want, presented in the visualizations you find most helpful.
2) Who came back and who didn’t?
It’s much more costly (and effortful!) to acquire a new participant than to retain an existing one. Education program health relies on strong student retention. The first step to improving student retention is understanding who actually returned and who you need to re-engage.
To answer this question, look at: Student data from this period (calendar year, fiscal year, season, etc.) compared to the previous period.
- Unique student ID
- Student name
- Student email
- Class start date
- Enrollment status
Then, follow these steps:
Step 1: Create last period’s student list. Include each student once, even if they took multiple classes.
Step 2: Match it against this period’s list using student ID. Label each previous student “Returned” or “Did not return”.
To do this in Excel:
Put the previous period’s student list on one tab called “Previous”. Put the current period’s student list on a tab called “Current”. Make sure student IDs are in column A and email addresses in column C.
“Previous” tab layout:
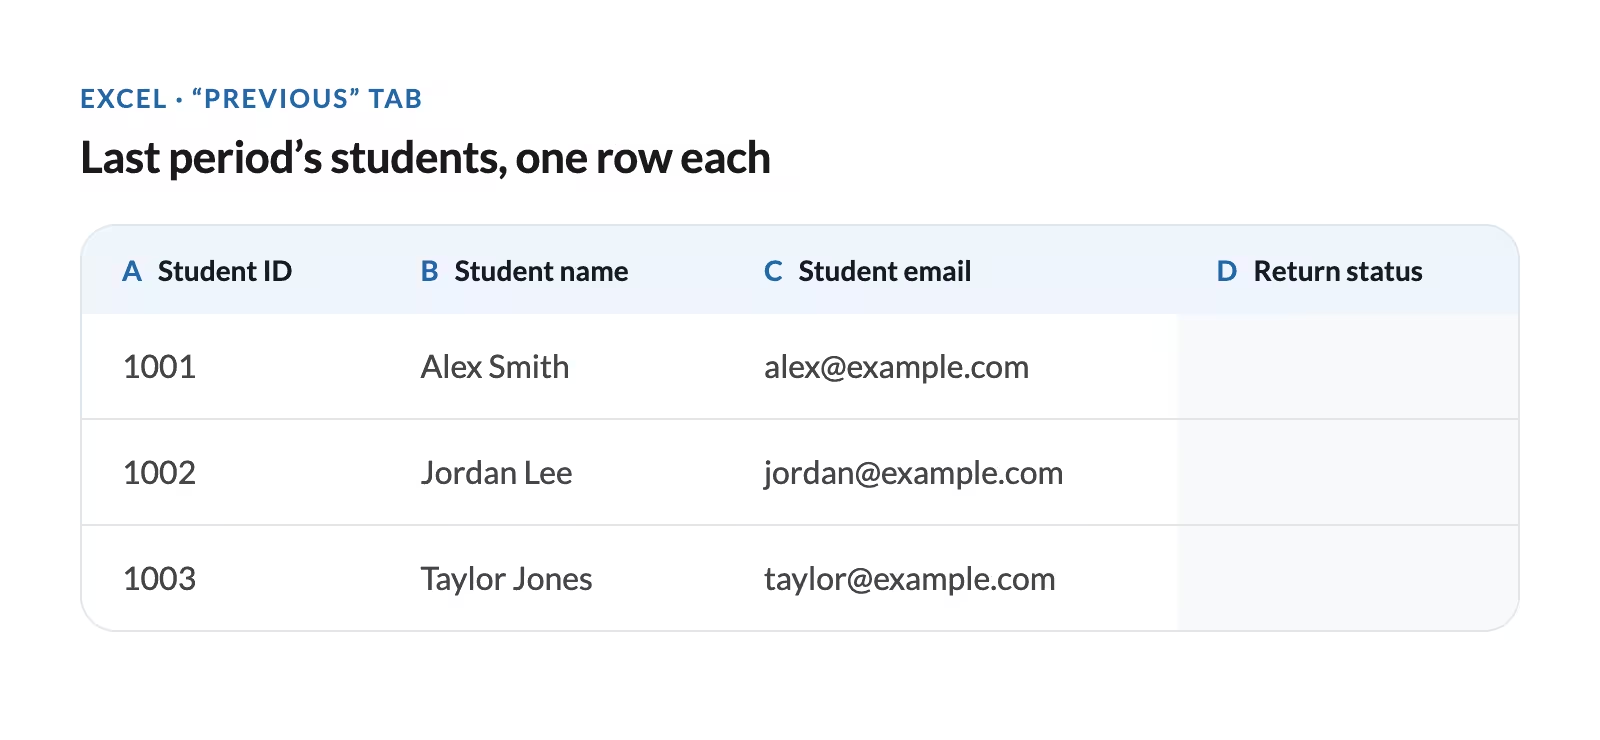
In cell D2 on the “Previous” tab, enter this formula and copy it down the column:
=IF(COUNTIF(Current!A:A,A2)+COUNTIF(Current!C:C,C2)>0,"Returned","Did not return")
This tells Excel: Look for this student’s ID or email anywhere in the “Current” tab. If either one is there, mark “Returned.” Otherwise, mark “Did not return.”
Step 3: Calculate your return rate. Students from the previous period who returned / all unique students in the previous x 100.
Example: 200 students enrolled last season, 40 of those students enrolled again this season.
40/200 x 100 = 20%
How to use this data
- Evaluate your return rate. Assess your return rate for this cycle and compare it to previous return rate trends at your organization. If return rate is increasing, you’re doing something right in terms of class offerings and promotion, keep it up! If return rate is decreasing, you’ll want to dig in deeper to understand and plan.
- Hypothesize as to why students didn’t return. Look for patterns in your non-returners. For example, you notice a large drop off among teen participants. Are they aging out of classes without a suitable next program? Revisit last season’s offerings. Or, students from one class didn’t return but their peers in a similar offering did. Did their experience differ? Check student and instructor feedback.
- Decide if and how you want to target non-returners next season. If your goal is to increase student retention, use what you’ve learned to prioritize and plan a re-engagement campaign for non-returners heading into next season. Get student re-engagement ideas and email templates here.
- Show leadership how you’re trending. Include the program’s return-rate in any end-of-period snapshot for leadership. If it’s strong and/or trending upward, pair it with a student story about why they keep coming back and what they’re gained. If it’s a concern, pair it with your additional learnings and concrete next steps; this builds your credibility as program owner.
Consider running this report in the other direction to determine your rate of new enrollees. If you have a strong retention rate but it’s under 100%, you also need to make sure you’re attracting enough new students to maintain overall growth.
Kate Brandt
Arts & Culture Consultant at Kate Brandt Marketing
Answering this question with CourseStorm
You can also answer this question in just a few minutes using CourseStorm’s reporting assistant. Here’s what the prompt might look like:
Create a table with exactly three columns: Student ID, Full Name, and Returned Status. Include one row for each distinct student who had a non-canceled registration for a class starting in calendar year 2025. If that same student ID has a non-canceled registration for a class starting between January 1, 2026 and today, mark them “Returned”; otherwise mark them “Did not return.” Exclude students who registered in 2026 but had no registration in 2025.
You can continue to prompt the reporting assistant to help you uncover patterns and give you actionable segments, like:
Break down the lowest-returning class category by individual course and location.
Compare attendance rates for returning and non-returning students.
Create a downloadable list of the non-returning students in that segment, with Student ID and full name.
3) Who did we reach?
Most arts education programs exist to create a positive impact in the community. If your organization has goals related to community impact, it’s critical to show how your education program is supporting and furthering those goals. Answering this question at each major transition cycle will help you tell this story.
To answer “who did we reach”, look at: The same student dataset you pulled to answer question two with a few additions:
- Student ZIP code
- Any demographic information you already collect voluntarily, such as:
- Race/ethnicity
- Household income
- School
Log missing responses as “Unknown/not provided”.
Group students by age group, ZIP code, and relevant demographics. Show the number and percentage of total students in each group; keep missing information as “unknown”. Compare the current period with the previous period to see how reach has changed period over period.
To do this in Excel:
Create two tabs, “Current” and “Previous” with one row per student. Make sure to remove duplicates in the Student ID column so you’re only looking at distinct students.
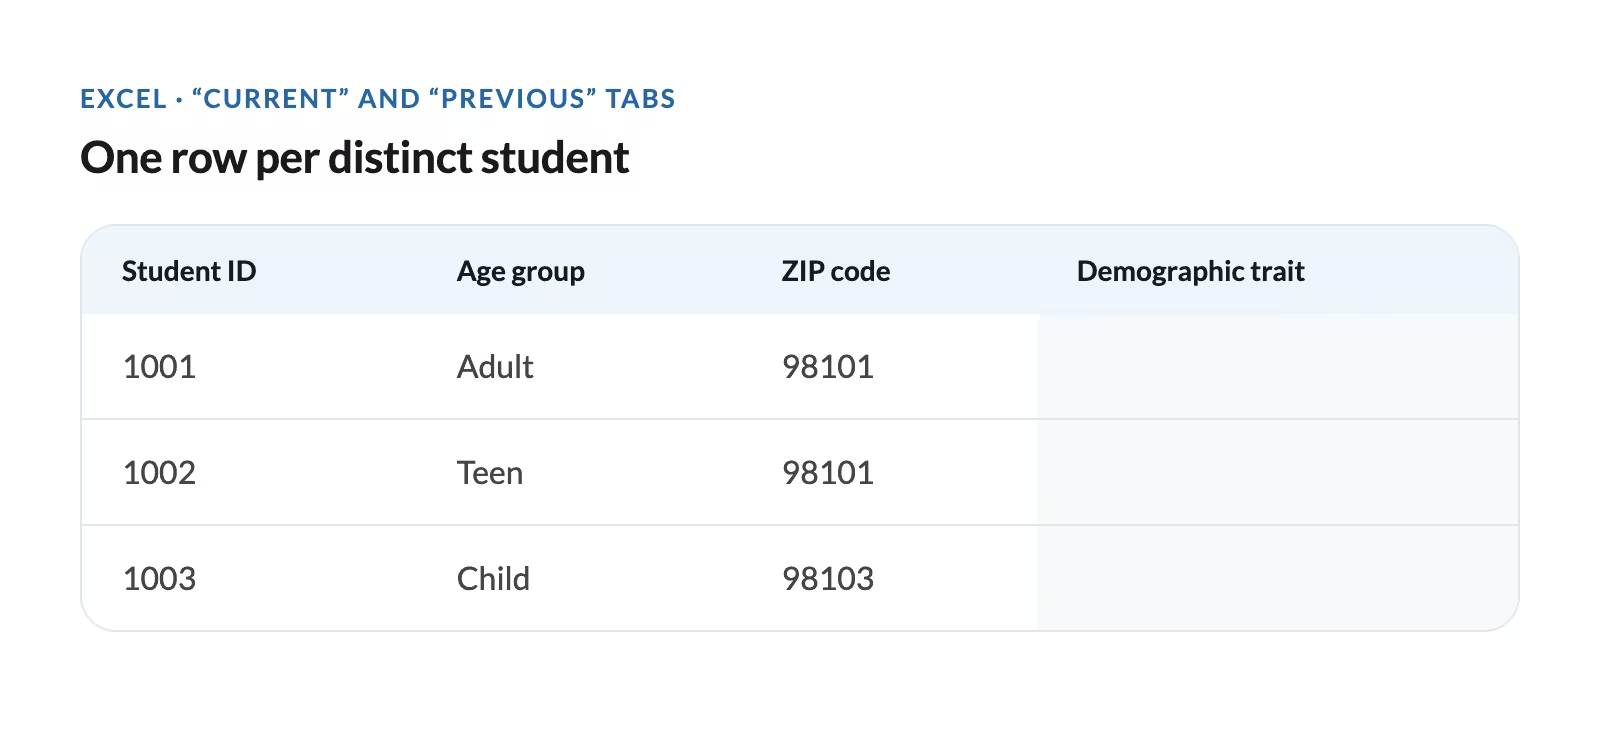
Create a Summary tab to count each group. Here’s an example summary tab for Age group:
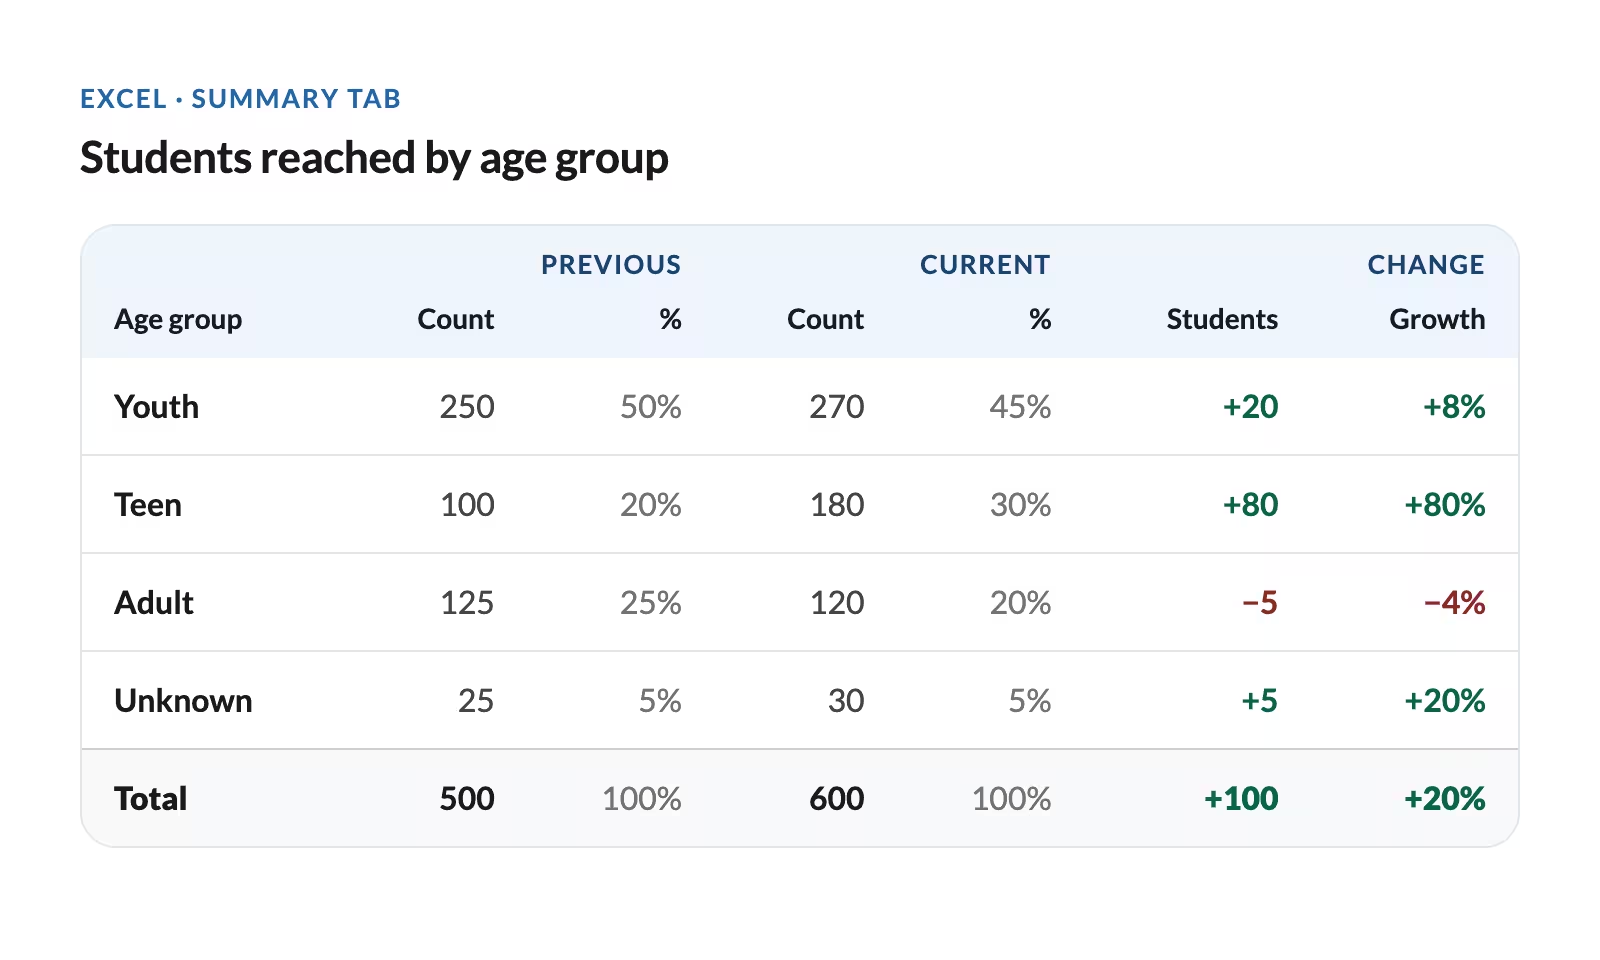
Use a separate summary table for each demographic characteristic you want to look at.
Protect students’ privacy: if any group has fewer than about 10 students, combine it with a similar group, or leave it out of anything you share. Small groups can make individual students identifiable, especially with sensitive information like household income.
How to use this data
- Check reach against mission. Compare the students you enrolled with the audiences and communities your organization is working to serve. Identify where reach expanded and gaps that need to be addressed.
- Prioritize gaps and plan. Prioritize any gaps and develop a plan or plans to address these gaps. If you’re trying to reach more teens in a particular location, look at the partners you have in that location: schools, after school programs, etc. How can these partners help you reach this audience? What new partners should you consider?
- Show reach results to leadership. Share reach numbers with leadership in your period-end snapshot. If you’re driving growth with a particular demographic, celebrate that success — share how you did it, the numbers, and a student impact story. If there are gaps in who you’re able to reach, highlight these as well. Transparency and concrete next steps may help you unlock additional resources.
Answering this question with CourseStorm
This is another question you can answer easily using Just Ask Reporting!
For the clearest results, you’d run separate prompts for age, ZIP, and demographics. Define “reached” explicitly, for example:
Unique students with a non-canceled registration, comparing 2026 year-to-date with the same dates in 2025. Show both the student counts and the numeric or percentage change.
Demographics are limited to data actually collected in CourseStorm, such as gender or non-private custom form responses.
Understanding and reporting on education program impact
Whether you’re reporting on the past calendar year or your most recent registration season, answering the questions in this article will give you a clear picture of program health. Getting this data empowers you to make informed decisions, advocate for your program to leadership, and compile impact stories to share with stakeholders.
Everyone knows data is important, but being able to turn the numbers into insights and actions is the really critical part. With more than 20 years of arts marketing experience, I know it can be easier said than done. CourseStorm’s advice provides concrete examples and actionable next steps to keep your eye on the numbers that matter to education programs.
Kate Brandt
Arts & Culture Consultant at Kate Brandt Marketing
In a follow-up article to this post, we’ll share three more key end of cycle questions, how to get the data you need and how to use that data, so stay tuned! Want to learn more about reporting in CourseStorm and how we can help you simplify class registration and operations? Let’s talk.


Save time and grow your impact with CourseStorm

